![]() This WEB page comes from the busTRACE 8.0 User's Manual. (Table of Contents)
This WEB page comes from the busTRACE 8.0 User's Manual. (Table of Contents)
|
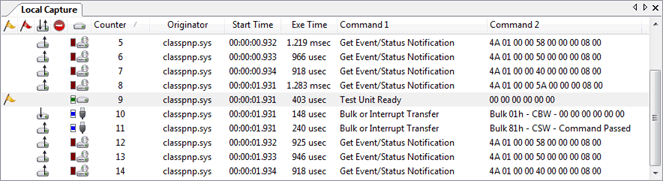
The I/O Capture List window shows you a list of all I/Os that have been captured. In the following example, we see I/O activity that has been captured across a variety of devices.
When you select an I/O, the details for that specific I/O will be shown in the I/O Details pane directly below. The tabbed windows in that pane allow you to view any errors that were detected for the I/O, specific details about the I/O, and a raw hex dump of any data that was transferred. The data that is displayed in the I/O Capture List is highly customizable. Please refer to the Customizing the I/O Capture List section for details on how to customize the layout of this window. If you float the mouse over the device icon, a tool tip will appear showing you the device name. See Also: |
|