| |
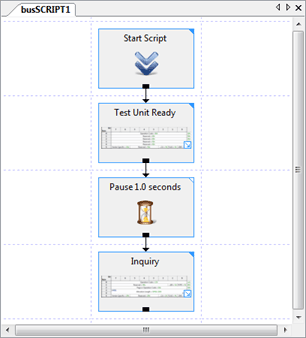
The Script Matrix window shows you your actual script. The script lays out the order in which your script nodes will execute against the enumerated devices.

In this very simple example above, the script will start by issuing a Test Unit Ready CDB, wait one second, and then issue an Inquiry CDB. You can add nodes from either the Script Nodes window or from the Predefined CDBs window.
Once script nodes have been added to your script, you can drag and drop the nodes around to position them to a preferred location. This can make the script more readable. You can right click drag and drop to have a context menu appear with the available drop options.
To edit a script node, simply double-clickon the node to get to the editable options.
Script Node Image
Each script node visual image is comprised of four different areas:

| Node Title |
The title area of the node will show you a brief description of what the node will do. In our example, the node indicates that a Test Unit Ready command will be sent to the device.
|
| Node Details |
A node icon will appear in the node details area. You can float the mouse over the icon to get additional details as to what the node will do. In the case of a Command Descriptor Block node, if you float the mouse over the downward arrow  , in the lower right, the CDB image will expand to visually show you the entire Command Descriptor Block that will execute. , in the lower right, the CDB image will expand to visually show you the entire Command Descriptor Block that will execute.
|
| Node Links |
When a script node has finished, it may be linked to one or more additional nodes. For example, if a CDB fails you may want the script to branch to one node. If it completes successfully, you may want the script to branch to another node. These branch points are called node links. The bottom portion of the script node image is reserved for node links.
|
| busTRACE Capture |
If you have configured busSCRIPT to capture script activity to a busTRACE capture file, on a per node basis you can configure the script whether to append the node results to the busTRACE capture file. A solid triangle indicates busTRACE capture is enabled for the node. A hollow triangle indicates that capture is not enabled.
You can click the mouse over this triangle icon to turn on or off busTRACE capture for the selected node.
|
See Also:
|
|
![]() This WEB page comes from the busTRACE 9.0 User's Manual. (Table of Contents)
This WEB page comes from the busTRACE 9.0 User's Manual. (Table of Contents)