Bookmark  |
This column shows you whether the I/O has a bookmark set or not. If the I/O has a bookmark set, a bookmark icon appears in this column.
|
| Bytes Captured |
This column shows you how many bytes of data have been captured for the given I/O. If you have configured busTRACE to capture less data than what was actually transferred, this value may be less than the Bytes Transferred described below.
|
| Bytes Requested |
This column shows you how many bytes were requested to be transferred. In other words, how large the original data buffer was. This may be larger than what was actually transferred. For example, if a command is issued to a device that will return between 0 and 256 bytes (depending on what data is available), the caller may set the original buffer size to 256 bytes. This way, there is enough space to store the entire data transfer.
|
| Bytes Transferred |
This column shows you how many bytes were actually transferred along with the I/O. This may be less than (but never more than) the Bytes Requested value described above. There are some circumstances where this value is always set to the Bytes Requested value, and does not represent the true number of bytes transferred. This is usually caused by a limitation of the underlying software driver or hardware. Additional details on this limitation can be found in our Troubleshooting busTRACE section.
|
Class Driver
|
This column shows you the class driver that the I/O request went through.
|
| Command 1 |
This column shows you text describing the I/O command sent. For a storage device, this is usually the name of the CDB being sent to the device (e.g. Test Unit Ready, Inquiry, etc.). For a USB device, this is usually the URB Function being sent to the device (e.g. Get Descriptor, Select Interface, etc.).
|
| Command 2 |
This column shows you more specific text describing the I/O command sent. For a storage device, this is usually the hex Command Descriptor Block being sent. For a USB device, this is usually additional details about the URB Function being sent.
|
| Counter |
This column indicates the order in which the I/Os were initiated.
|
Data Underrun 
|
This column will show a blue flag icon whenever a data underrun is detected. A data underrun occurs when the data transferred is less than the data requested. For example, you issue an Inquiry CDB with a 128 bytes buffer and only 36 bytes are returned. This is a data underrun. Data underruns are not normally considered an error but can be if the device does not transfer as much data as expected.
|
Device  |
This column displays an icon for the device that the I/O was sent too. This is the same icon that appears in the Capture Devices pane. If you float the mouse over the device icon, in the I/O Capture List, busTRACE will show you the full device name in a tool tip.
|
| Device ID |
This column will show you the Port Number, Path ID, Target ID, and LUN for the device that processed the captured I/O. This field is only applicable to storage devices. If no such value is available, the field is left empty.
|
Device Name
|
This column shows you the device name (i.e. the name that appears in the Capture Devices Tree).
|
| Device Pointer |
This field shows you a unique 32-bit or 64-bit value that is used internally to represent the device that processed the I/O request. When you are capturing I/O activity, this field shows you the PDEVICE_OBJECT pointer value for the device object that received the IRP request. For busPROBE or busSCRIPT, the value is an internally used pointer.
|
| Device Serial Number |
This column shows you the device serial number (if available).
|
| End Time |
This column displays when the I/O finished. You can customize how the I/O timing is displayed.
|
Error Indicator  |
This column indicates whether the I/O succeeded or failed. If successful, nothing appears in this column entry. If the I/O fails, an error icon will appear.
NOTE: If busFAULT was the one that generated the I/O failure, a busFAULT icon will appear instead. This provides a quick method for you to determine if the failure was returned by the device or simulated by busFAULT. |
| Execution Time |
This column displays the time it took for the I/O to execute. You can customize how the I/O timing is displayed.
|
I/O Direction  |
This column shows you whether data is being transferred to the device  (data out) or from the device (data out) or from the device  (data in). If no data is transferred, nothing appears in this column. (data in). If no data is transferred, nothing appears in this column.
|
| I/O Interleave Arrows |
If you have configured busTRACE to view interleaved I/O activity (one showing the I/O going down the stack, and the other going up the stack), this column shows you how the I/Os are interleaved by drawing an arrow from where the I/O starts to where the I/O finishes.
|
| I/O Timeout |
This column displays the timeout set for the given I/O.
|
IRP Direction  |
This column indicates whether the I/O is going down  the I/O stack or going back up the I/O stack or going back up  the I/O stack. This is only applicable if you have configured busTRACE to view interleaved I/O activity. If busTRACE is configured in its default state of not viewing interleaved I/O activity, then this column will simply show you a double arrow indicator. the I/O stack. This is only applicable if you have configured busTRACE to view interleaved I/O activity. If busTRACE is configured in its default state of not viewing interleaved I/O activity, then this column will simply show you a double arrow indicator.
|
| IRP Pointer |
This field shows you a unique 32-bit or 64-bit value that is used internally to represent the I/O request. When you are capturing I/O activity, this field shows you the PIRP pointer value for the IRP that was sent to generate the I/O request. For busPROBE or busSCRIPT, the value is an internally used pointer.
|
IRP Status
|
This field shows you the IRP's 32-bit return status.
|
| IRP Type |
This column shows you the type of I/O Request Packet (IRP) that was captured. Details on types of I/O Request Packets are described in Microsoft's Windows Driver Development Kit. One of the following fields will be displayed here:
| SRB |
This value indicates a standard IRP_MJ_SCSI request (i.e. SRB/CDB) was captured. |
| exSRB |
This value indicates an extended SRB (i.e. STORAGE_REQUEST_BLOCK) was captured. |
| SPTI_BUFFERED |
This value indicates an IOCTL_SCSI_PASS_THROUGH request was captured. This request is typically sent by a ring 3 application (i.e. Windows application) to send a CDB to a storage device. |
| SPTI_DIRECT |
This value indicates an IOCTL_SCSI_PASS_THROUGH_DIRECT request was captured. This request is typically sent by a ring 3 application (i.e. Windows application) to send a CDB to a storage device. |
| IOCTL |
This value indicates an IOCTL was captured. |
| USB/URB |
This value indicates a low-level USB Request Block (URB) was captured. |
| IRP_MJ_POWER |
This value indicates a power management IRP was captured. |
| IRP_MJ_PNP |
This value indicates a Plug and Play IRP was captured. |
|
| LBA |
If dealing with storage class devices (e.g. hard drive, CD/DVD drive), and a read, write, or verify is issued, this column shows you the I/O request's starting Logical Block Address (LBA).
|
LBA Alignment |
This column shows you the I/O alignment for the given I/O in number of blocks. For example, a value of 8 means it's aligned to 8 blocks which is 4K for a 512 byte block. You can click on the "LBA Align" column header to sort based on that value if you want to easily find any I/Os which are unaligned. |
| LBA Count |
If dealing with storage class devices (e.g. hard drive, CD/DVD drive), and a read, write, or verify is issued, this column shows you the number of blocks requested by the I/O. |
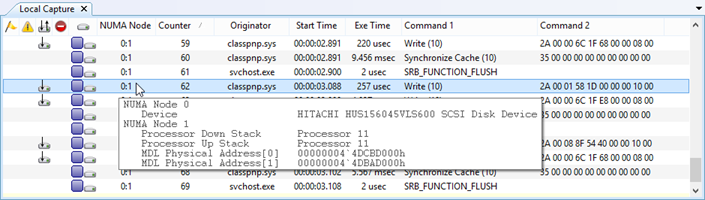
| NUMA Node |
This column shows you the NUMA Node the I/O was processed on. Floating the mouse over the value shows you the specific NUMA node values. For example:
|
| Originator |
If we are able to determine which driver submitted the I/O request, the name of the driver will appear here.
NOTE: If we detect that the I/O is being sent directly to the port driver, bypassing the I/O stack, we place an "[x]" indicator to the right of the originator name. We can only detect this if busTRACE's Advanced Filtering option is enabled.
|
| Raw Data |
This column will show you up to the first eight bytes of data transfer. You can click on the column header to sort on this field if you like. If there are more than eight bytes available, "..." is appended to the end of the entry.
If you float the mouse over the raw data, a tooltip will appear that will show you up to 128 bytes of the raw data. Both hex and ASCII data are shown. |
| Sense Data |
If dealing with storage class devices (e.g. hard drive, CD/DVD drive, etc.), and a check condition occurs, this column will show you three hex bytes. The first is the sense key followed by the sense code followed by the sense code qualifier.
|
| Sense Data (All) |
This column is identical to the "Sense Data" column as described directly above. The difference is that this column will show you all of the sense data (up to 18 bytes) in hex format.
|
| SRB Status |
If the I/O captured is a SCSI_REQUEST_BLOCK, or STORAGE_REQUEST_BLOCK, this column would show you the SrbStatus field.
|
| Start Time |
This column displays when the I/O started. You can customize how the I/O timing is displayed.
|
| Target Status |
If the I/O captured is a SCSI_REQUEST_BLOCK, or STORAGE_REQUEST_BLOCK, this column would show you the ScsiStatus field.
|
Thread ID
|
If you captured the I/O using busSTRESS, this column shows you the thread ID the submitted the Windows file system API.
|
Time Between I/Os
|
This column shows you the time between the last I/O initiated on this device object and this I/O. |
Trigger Indicator  |
This column shows you whether the I/O hit a trigger point or not. If the I/O did hit a trigger point, a trigger icon appears in this column.
|
| User Comment |
If a user comment is attached to a given I/O, floating the mouse over the list item will display a tool tip with that user comment. You can choose to view all user comments in their own column by selecting this option.
|